
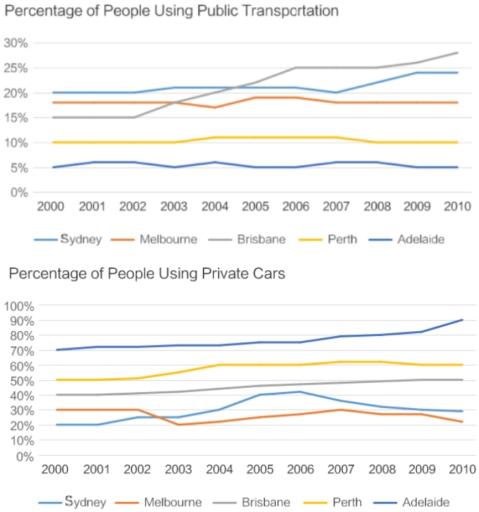
The line graph illustrates various shifts in the rate of those who possess individual cars in five different cities in Australia from 2000 to 2010.
Overall
, Adelaide had the highest rate of owners of private vehicles Linking Words
whereas
Sydney and Melbourne had the lowest. There were Linking Words
also
generally upward trends in Adelaide, Perth and Brisbane Linking Words
while
more fluctuations occurred in Sydney and Melbourne.
Starting with Adelaide whose figure stood the highest at 70% in 2000, there was a gradual growth until 2009, from which it started to rise more rapidly from Linking Words
slighy
over 80% to just above 90% between 2009 and 2010. The next highest city was Perth with a radical increase from approximately 50% in 2002 to 60% in 2004 showed no significant change by 2010. Brisbane demonstrated a more constant rise from 40% to 50% for the ten years.
Turning to Melbourne which experienced a huge drop from 30% in 2002 to 20% in 2003, it generally showed a downward trend in spite of the continual rise by 10% between 2003 and 2007. As for the graph for Sydney, it stood the lowest at 20% in 2000 and skyrocketed to more than 40% by the next six years and Correct your spelling
slightly
then
it started to decline to about 30% in 2010.Linking Words