
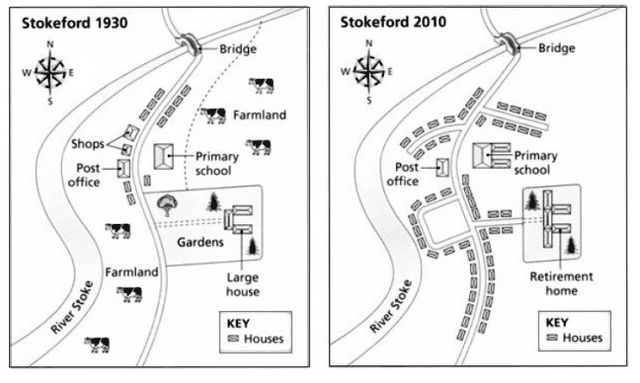
The maps display the village of Stokeford in two different years 1930 and 2010. It is clear from the graph that , the primary school increased in size,
as well as
the residential area, which is located on both sides of the road. Linking Words
Also
, there are appeared some new features.
Linking Words
According to
what is shown, Linking Words
Firstly
, the biggest change, which is the most noticeable is that the gardens changed to retirement home. Linking Words
Although
, there are a couple of trees left there. The road became bigger and more variable through the years. Linking Words
In addition
, to changes, there is no more farmland in 2010.
Linking Words
To sum up
, we could say that, there are some things, which did not change, Linking Words
such
as the post office, the location of the bridge and the main road. Linking Words
In contrast
, the shops disappeared from the map in the second given year.Linking Words