
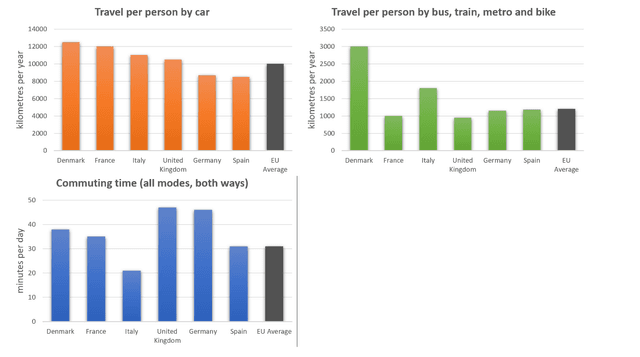
The bar charts display figures for road transport in several European countries, including
Denmark
, France, Italy, the United Kingdom, Germany, and Spain, and the European average, in terms of kilometres per year and miles per day.
Use synonyms
Overall
, Linking Words
it is clear that
Linking Words
Denmark
has the highest number of kilometres per year travelled per person by car, with over 12,000, Use synonyms
while
the EU average is 10,000. In Linking Words
Denmark
, the average travel per human by bus, train, metro, and bike is 3000, which is higher than the European average of around 1000. The United Kingdom has the highest commuting time with all modes, both ways, at 45 minutes per day, whilst the eurozone average is 30 minutes. It is worth noting that Use synonyms
Denmark
has the highest travel rate compared to other countries.
In total, data are provided on trips per man by private cars, trips per person by bus, train, underground and bicycle, and journey time by all modes and in both directions.Use synonyms