
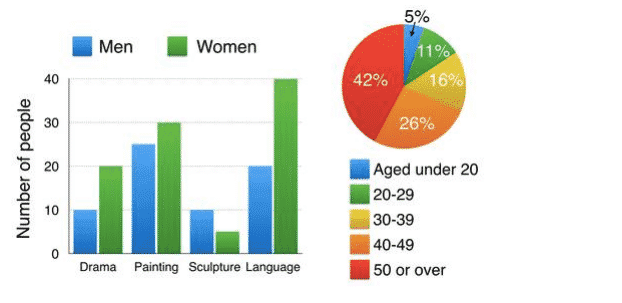
The provided bar
chart
gives information about the proportion of males and females who participated in four different evening courses at the Use synonyms
center
of adult education in 2009, and the pie Change the spelling
centre
chart
illustrates the percentage of ageing groups in five categories among these subject attendance. Use synonyms
Overall
, it is clearly seen that women joined all classes rather than men, except Linking Words
the
sculpture study. As can be seen, people above 50 tended to join, which was the most popular Change preposition
in the
age
.
Use synonyms
According to
the bar Linking Words
chart
, there were three courses in the adult education centre, namely, drama, painting, and language, indicating women attended more than men. First of all, 40% of the 2-fold more females than 20% of male adults join the language club by 20%. At Use synonyms
this
stage, the proportion of drama (56%) and painting (30%) courses attended by both genders.
Linking Words
Therefore
, joining sculpture experienced that the percentage of men was larger than women, to merely 5%. Linking Words
As a result
, the figure had the lowest number of participants in all subjects.
Moving to the pie Linking Words
chart
, the figure depicted distinctive Use synonyms
age
groups, including those aged under 20, 20–29, 30-39, 40–49, and 50 or over. Use synonyms
Firstly
, the largest percentage witnessed by the Linking Words
age
of above 50 was 42%, which was eight times higher than the smallest number of people under 20. At Use synonyms
this
stage, the second popularity of the Linking Words
age
segment was 40–49 (26%). The proportion of people aged 20 to 39 was approximately 15%.Use synonyms