
#sample
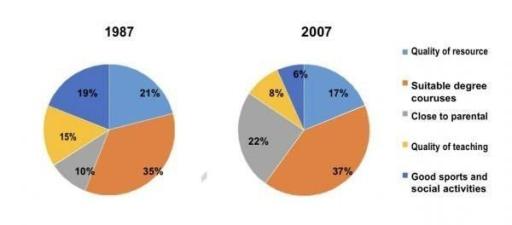
The pie charts show the primary reasons for choosing a certain
university
based in the United Kingdom in 1987 and 2007. Use synonyms
Overall
, the preponderance of students opted for Linking Words
this
Linking Words
university
because it offered suitable degree courses in both years, albeit with the smallest change. It is Use synonyms
also
clear that the location of the Linking Words
university
, which was the least significant factor in 1987, became the second major incentive for students in 2007.
Examining the factors that became more important Use synonyms
first,
more than a third of students (35%) chose the Linking Words
university
in question for its curriculum in 1987, a figure which slightly rose to 37% in 2007. Another reason that saw a modest increase was Use synonyms
quality
of teaching, growing from 15% to 18%. The third factor for choosing Correct article usage
the quality
this
Linking Words
university
whose importance surged was its proximity to students’ parental Use synonyms
home
, with the percentage rising from just 10% to 22%.
Fix the agreement mistake
homes
By contrast
, the remaining reasons became less crucial. Quality of resources, which was the second main reason for choosing Linking Words
this
Linking Words
university
in 1987, saw a slight fall from 21% to 17%. The biggest decrease, Use synonyms
however
, was observed in the “good sports and social activities” category: its figure plummeted from Linking Words
initial
19% to a chart low of 6%.Correct article usage
an initial