
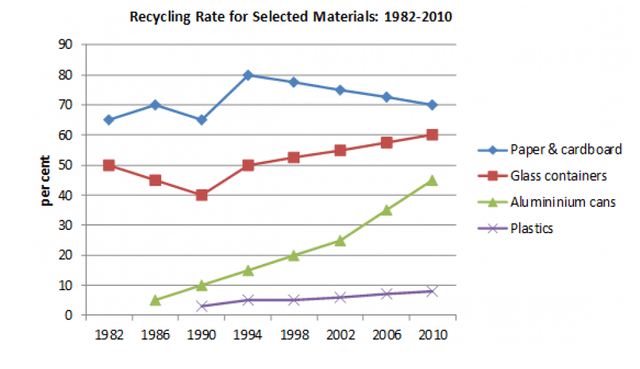
The information about the percentage of four varied waste materials'
recyclation
from 1982 to 2010 in some popular Correct your spelling
recyclate
country
is depicted in the given line graph. The information is calibrated in the form of Fix the agreement mistake
countries
percentage
.
Fix the agreement mistake
percentages
Overall
, the most striking feature of the given chart is that glass containers and aluminium cans were seen following Linking Words
a
increasing trend in terms of Change the article
an
resusing
, Correct your spelling
reusing
while
paper and cardboard saw a decrease in Linking Words
its
reprocessing.
Taking a cursory glance, it can be manifested that paper and cardboard recycling started from early 65% in 1982 Correct pronoun usage
their
reached
Correct word choice
and reached
at
80% in 1994 with some fluctuations before decreasing Change preposition
apply
continuosly
to 70% in 2010. Correct your spelling
continuously
Furthermore
, in the year 1982, Linking Words
exact
50% Change the word
exactly
glass
containers were brought into Change preposition
of glass
resuse
which later suffered a fall till 1990 and Correct your spelling
reuse
then
followed a Linking Words
consistant
rise to reach Correct your spelling
consistent
at
60% in 2010.
Moving to Change preposition
apply
further
details, the recycling of aluminium cans Linking Words
begin
in 1986 when only 5% Wrong verb form
began
cans
were converted into new materials. Change preposition
of cans
However
, Linking Words
this
process became increasingly popular and it eventually hit just above 40% in 2010. Linking Words
Lastly
, the reprocessing of plastics was less popular, Linking Words
therefore
; it was Linking Words
initially
similar to the former one and by 2010 it was merely noted as 9%.Linking Words