
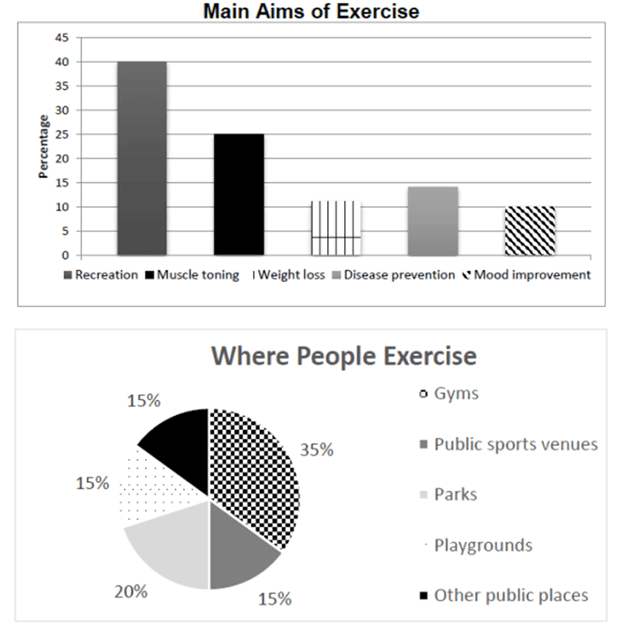
The charts give information about the survey which adult's primary exercise targets and the places where people go there to do physical activities between 20 and 50 years of age.
Overall
, Linking Words
it is clear that
40% of people do sports for recreation, which is the highest of the five different aims Linking Words
while
improving mood is the lowest rate at 10%.
Linking Words
To begin
with, people prefer to work out at the gym, which was approximately 35%; Linking Words
however
, there is only 25% for muscle toning, which was lower than the target for amusement at 15% accidentally. Linking Words
In addition
, the second choice which individuals exercise is the park, which means they like to breathe the fresh air rather than staying in the indoor space.
Linking Words
Moreover
, the percentage of losing weight and preventing diseases is lower than 15%, which is at 14% and 11% respectively. The locations where youngsters keep their fitness are playgrounds, public sports venues and other places and all of them are 15%.Linking Words