The charts below shows the value of one country’s exports in various categories during 2015 and 2016. The table shows the percentage change in each category of exports in 2016 compared with 2015.

The charts below shows the value of one country’s exports in various categories during 2015 and 2016. The table shows the percentage change in each category of exports in 2016 compared with 2015.
There are
two
visuals that deliver
two
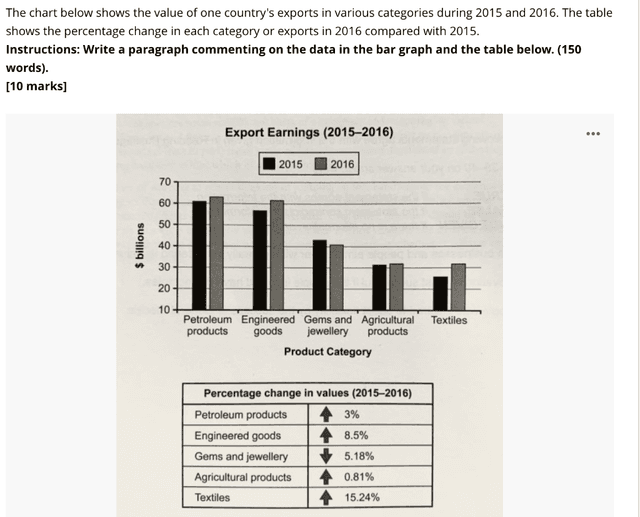
different aspects of a particular country's exports from 2015 to 2016. The bar chart tells how valuable are the various commodities in billions of dollars. Below the first figure, a table shows a series of percentage shifts among those goods. In general, the most profitable item is petroleum products, it always dominates the market in
two
years.
However
, textiles that came least in the chart, were found to have a significant increase in terms of values. From the first image, almost every necessity has climbed up slightly in generating money, except for luxury things. Engineered and clothing wares share about the same jump between 5 to 10 billion dollars. One-
two
lower difference occurs between petroleum and natural products, compared to the
two
previous objects. Turning to the table, gems and jewellery are still accountable as the only items that suffer from a decline
at
Change preposition
of
show examples
5 %. Followed by a small increase of under 1% in agricultural goods. Engineered wares stand as the second biggest change, almost three times bigger than petroleum objects.
Submitted by aryasblearning on

Unauthorized use and/or duplication of this material without express and written permission from this site’s author and/or owner is strictly prohibited. Excerpts and links may be used, provided that full and clear credit is given to Writing9 with appropriate and specific direction to the original content.

Linking words: Add more linking words.
Vocabulary: Replace the words two with synonyms.
Vocabulary: Rephrase the word "percentage" in your introduction.
Vocabulary: The word "chart" was used 2 times.
Vocabulary: The word "table" was used 2 times.
Vocabulary: The word "increase" was used 2 times.
Vocabulary: The word "almost" was used 2 times.
Topic Vocabulary:
  • exports
  • categories
  • value
  • percentage change
  • compare
  • trends
  • changes
  • chart
  • table
  • overview
  • introduce
  • highlight
  • describe
  • summarize
  • information
What to do next:
Look at other essays: