
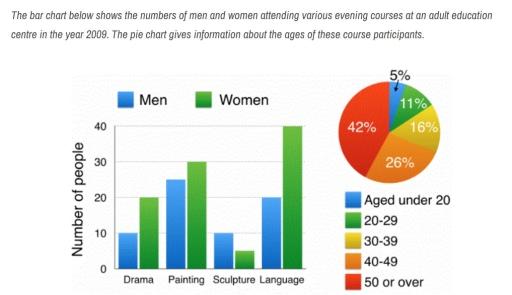
The bar and pie chart
depicts
the data about the adult education Correct subject-verb agreement
depict
center
, which includes different events attendings of by gender and the percentage of their Change the spelling
centre
age
groups in the year 2009.
Use synonyms
Overall
, it is clearly shown that Linking Words
women
tend to Use synonyms
more
activities compared to men, and the Add a missing verb
do more
age
Use synonyms
group
of 50 and Use synonyms
Linking Words
further
Fix the agreement mistake
older
people
Use synonyms
more
likely to visit the Add a missing verb
are more
center
.
A Change the spelling
centre
more close
look at the statistics, in terms of the Correct word choice
closer
women
, the language training is the highest allocation with 40 Use synonyms
women
in the bar chart, which is four times higher number than the Use synonyms
women
who participated in the sculpture training. Use synonyms
Conversely
, 30 men participated in the Linking Words
the
painting class, which is the highest participation of the men. Remove the redundancy
apply
Moreover
, drama and sculpture classes are filled by the exactly same number of participants with 10.
In terms of the Linking Words
age
Use synonyms
group
, participants Use synonyms
who
under 20 Correct pronoun usage
apply
are represents
the lowest percentage with 5 Change the verb form
represent
percent
. Change the spelling
per cent
Conversely
, the oldest Linking Words
age
Use synonyms
group
of Use synonyms
people
(50 or more) attended the course mostly which was represented Use synonyms
with
42 Change preposition
by
perfcent
. Correct your spelling
per cent
Furthermore
, Linking Words
people
of Use synonyms
40
-49 Correct article usage
the 40
age
Use synonyms
group
of Use synonyms
people
attended Use synonyms
by
26 Change preposition
apply
percent
and Change the spelling
per cent
other
two Correct article usage
the other
age
groups of participants Use synonyms
nearly
Add a missing verb
were nearly
same
and allocated Correct article usage
the same
with
11-16 Change preposition
apply
percent
.Change the spelling
per cent