
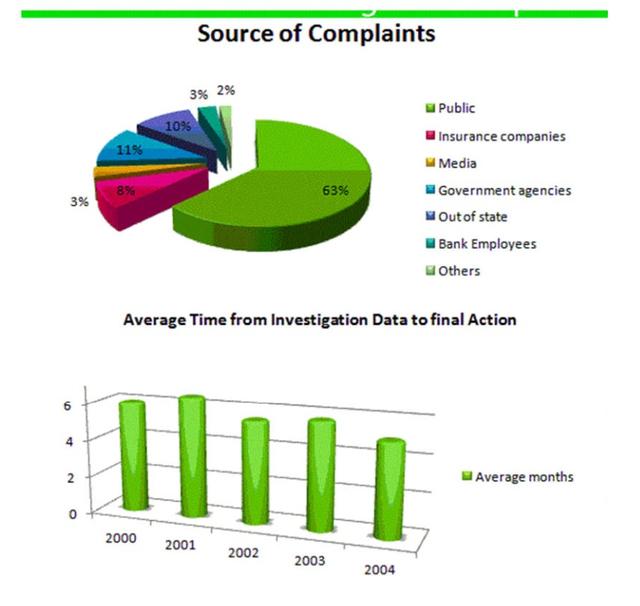
The two graphs depict different information related to
complaints
within the Use synonyms
Use synonyms
bank
of America. The pie Capitalize word
Bank
graph
shows the sources of Use synonyms
complaints
, Use synonyms
while
the bar Linking Words
graph
illustrates the average Use synonyms
time
taken between investigation into Use synonyms
complaints
and final action taken.
In general, by far the highest number of Use synonyms
complaints
against the Use synonyms
Use synonyms
bank
of America originated from the public. The bar Capitalize word
Bank
graph
shows the average Use synonyms
time
period between investigation and action is around 5 Use synonyms
months
.
63% of all Use synonyms
complaints
against the Use synonyms
Use synonyms
bank
of America are lodged by the public. Of the remaining 37% of Capitalize word
Bank
complaints
, the figures can be grouped into percentages between 11 and 8%, which are made up of government agencies, out-of-state agencies, and insurance companies. Use synonyms
Then
interestingly, media and Linking Words
bank
Use synonyms
employee
made up Fix the agreement mistake
employees
and
equal figure, 3% in the chart.
The bar Correct your spelling
an
graph
shows that 2001 had the highest waiting Use synonyms
time
for Use synonyms
complaints
of medical misconduct at 6 Use synonyms
months
. Use synonyms
Although
there is a significant drop from 6 Linking Words
months
in 2001 to 5 Use synonyms
months
in 2002, all previous and proceeding years display an average waiting period of 5 Use synonyms
months
. Despite Use synonyms
this
, over Linking Words
time
the average waiting period is decreasing.Use synonyms