
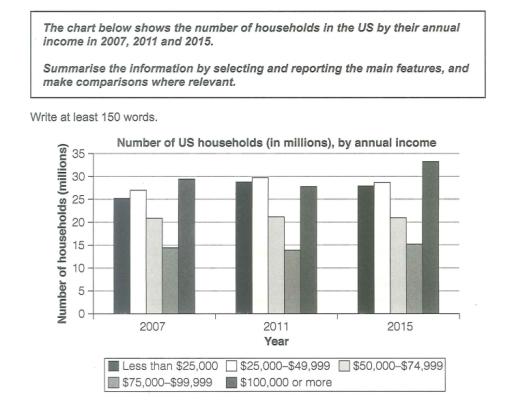
The bar chart shows information regarding the annual revenue of
families
in the United States 4 Use synonyms
years
apart starting in the year 2007 and ending in 2015.
Use synonyms
Overall
, the data presents an increase in annual profit of American Linking Words
families
earning 100,000 Use synonyms
dollars
or more from 2007 to 2015 Use synonyms
whereas
households accumulating more than 50,000 but less than 100,00SUD yearly showed a constant number throughout the Linking Words
years
but Use synonyms
then
an influx of Linking Words
families
earning equal to and less than 49,000 Use synonyms
dollars
in a period of 8 Use synonyms
years
.
In 2007, pertaining to Use synonyms
families
having a yearly revenue of 100,000 Use synonyms
dollars
or more, it stood at about 29 Use synonyms
million
households and jumped to more than 30 Use synonyms
million
in the span of 8 Use synonyms
years
. Use synonyms
However
, the chart showed a slight decrease in 2011 at about 27 Linking Words
million
and Use synonyms
families
earning in the range of 25,000 USD overtook the highest position roughly at 30 Use synonyms
million
and at close second are earners with less than 25,000 Use synonyms
dollars
with approximately 29 Use synonyms
million
households.
Use synonyms
On the other hand
, the annual revenue of Linking Words
families
earning in the range of 50,000 Use synonyms
dollars
to 74,999 Use synonyms
dollars
and 75,000 USD to 99,999 USD remained constant in the span of 8 Use synonyms
years
which were approximately equal and less than 15 Use synonyms
million
for the former and about 21 Use synonyms
million
respectively for their 12-month earnings as a familyUse synonyms