
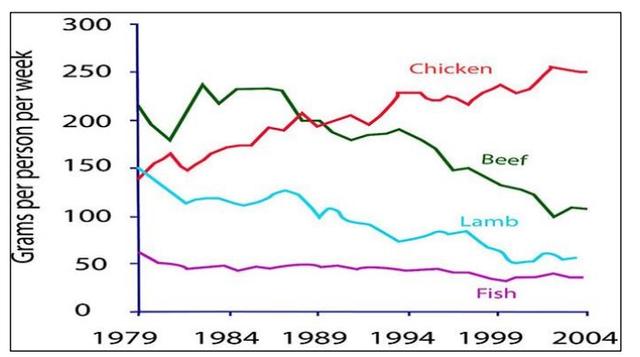
The line graph illustrates 3 kinds of meat and
fish
being consumed by some countries in Europe from 1979 to 2004.
Use synonyms
Overall
, despite the popularity of Linking Words
beef
at the start of the year, it started to decline significantly Use synonyms
along with
Linking Words
fish
and lamb Use synonyms
while
chicken rose dramatically throughout the period.
In 1979, Linking Words
beef
was the most popular meat by consumers which stood at more than 200 Use synonyms
grams
sold per week. Use synonyms
This
was far higher than lamb and chicken, which both were eaten about 150 Linking Words
grams
per 7 days. Use synonyms
Whereas
Linking Words
fish
was the least consumed among all of them with less than 100 gms per person. Use synonyms
However
, as the Linking Words
years
went by, Use synonyms
beef
drastically dropped in 1994 sold only approximately 160 Use synonyms
grams
, met a minimal rise until 1989 and plummeted to only 100 Use synonyms
grams
in 2004.
Use synonyms
On the other hand
, chicken's popularity among consumers steadily increased from 150 to 200 Linking Words
grams
in 20 Use synonyms
years
. It steadily grew and overtook Use synonyms
beef
in 1994, Use synonyms
then
rapidly rose from 1999, and peaked in 2004 with about 250 Linking Words
grams
being sold per week. Both lamb and Use synonyms
fish
slowly declined throughout the Use synonyms
years
, with the former marked a decrease to less than a hundred Use synonyms
grams
eaten and the latter with less than 50 Use synonyms
grams
consumed after 15 Use synonyms
years
.Use synonyms