
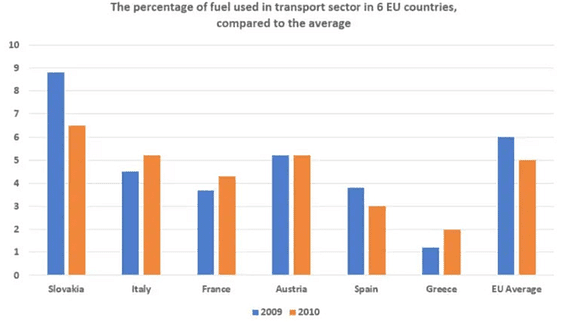
The graph demonstrates the consumption of
fuel
in Slovakia, Italy, France, Austria, Spain and Greece. Two time periods were compared.
Use synonyms
Overall
, it is evident from the data that, in 2009 among all the countries just Slovakia used more Linking Words
fuel
than the average. In general Use synonyms
fuel
consumption decreased in 2010, Use synonyms
however
in Italy, France and Greece there was an incline.
It is interesting to note that Greece's transport sector consumed the least amount of resources for two years straight, even so, there was a rapid growth in numbers by around 1 per cent. Linking Words
On the other hand
, 2010 witnessed a drastic fall in Linking Words
fuel
consumption in Slovakia, Use synonyms
however
, the number was still bigger than the average of 1,5 per cent.
It is noticeable that Austria was the only country whose Linking Words
fuel
usage had remained at the same point of 5,1 per cent. Use synonyms
While
Italy and France increased their usage of Linking Words
fuel
in the transport sector.Use synonyms