
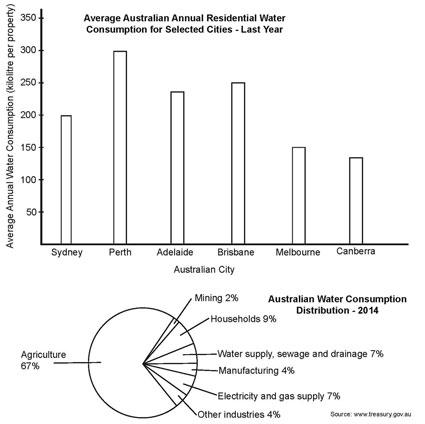
The bar chart illustrates how much
water
was consumed by residents per year in 6 different cities, Use synonyms
while
the pie chart depicts how Linking Words
water
was distributed during the given period. Use synonyms
Overall
, it is evident that Perth was at the top in terms of used Linking Words
water
and the major proportion of Use synonyms
water
was used for agricultural purposes.
As regards the bar chart, Perth ranked Use synonyms
first,
with 300 Linking Words
Use synonyms
kiloliter
. The Change to a plural noun
kiloliters
water
consumption of Brisbane and Adelaide was almost the same with just under 250 Use synonyms
Use synonyms
kiloliter
, which was followed by Sydney, at approximately 200 Change to a plural noun
kiloliters
Use synonyms
kiloliter
. The less Change to a plural noun
kiloliters
water
usage Use synonyms
beloned
to Melbourne and Canberra, which stood at nearly 50 Correct your spelling
belonged
Use synonyms
kiloliter
for Change to a plural noun
kiloliters
previous
year.
In terms of distribution of consumed Add an article
the previous
water
, the largest proportion of Use synonyms
water
accounted for agriculture, with 67%, Use synonyms
then
households stood in Linking Words
the
second place, with just under 10%. The proportions of both Electricity and gas supply and Correct article usage
apply
water
supply, sewage, and drainage were equal, at 7%. For manufacturing and mining, 4% and 2% of Use synonyms
water
is used, respectively. The remaining 4% went to other industries.Use synonyms