
The
line
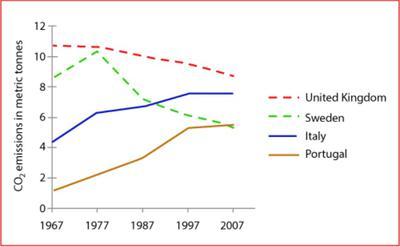
graph illustrates the average Carbon dioxide emissions by an individual person in various European countries for about 40 years time Use synonyms
period
.
Use synonyms
Overall
,the UK and Linking Words
Sweden
graphs are downtrend,Use synonyms
while
Italy and Portugal graphs are uptrend.
In 1967,the United Kingdom was the highest CO2 emission country at almost 11 metric Linking Words
tonnes
and Use synonyms
Sweden
was the second highest on the list at around 9 metric Use synonyms
tonnes
,which was double that of Italy(over 4 metric Use synonyms
tonnes
) and fourth times bigger than Portugal.The UK carbon emission decreased gradually and
ended up at nearly 9 metric Use synonyms
tonnes
.Use synonyms
Sweden
's graph decreased dramatically and closed under 6 metric Use synonyms
tonnes
.
Use synonyms
By contrast
,Italy's trend Linking Words
line
increased steadily over the Use synonyms
period
of time and finished at almost 8 metric Use synonyms
tonnes
,which was nearly double than starting point.Use synonyms
Moreover
,Italy finished the Linking Words
period
in the second Use synonyms
period
.Portugal started the journey with the lowest point among the countries,but gradually increased Use synonyms
line
ended the journey near about 6 metric Use synonyms
tonnes
Use synonyms
along with
Linking Words
Sweden
's Use synonyms
line
.Use synonyms