
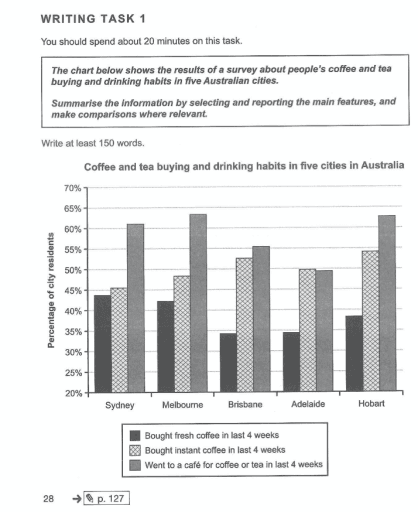
The bar graph illustrates in percentages the frequency with which the Australian population drinks
coffee
and tea in 5 different Use synonyms
cities
.
In general, the population in all four Use synonyms
cities
has demonstrated throughout the data that they prefer to drink caffeine outside of their places of residence. Use synonyms
In addition
, in the Linking Words
last
four Linking Words
weeks
individuals have drunk more instant espresso than fresh.
Add a comma
weeks,
Firstly
, more than 50% of the population in Linking Words
cities
Use synonyms
such
as Sydney, Melbourne, Brisbane and Hobart had had Linking Words
a
Correct article usage
apply
coffee
or tea in a Use synonyms
coffee
shop in the Use synonyms
last
month. Linking Words
Whereas
, in Adeleine less than half of the community went out for caffeine or tea in the same time period.
Linking Words
Secondly
, the community that took instant Linking Words
coffee
in the Use synonyms
last
month presented a significant fluctuation between Linking Words
cities
. Use synonyms
For example
, three metropolises were below 50% of preferences, with only Brisbane and Hobart reaching more than half but less than 55%. Linking Words
In addition
, the lowest preferences were the same in all five Linking Words
cities
, which was fresh Use synonyms
coffee
in the Use synonyms
last
month, with some metropolises achieving less than 35% of total preferences.
Translated with DeepL.com (free version)Linking Words