
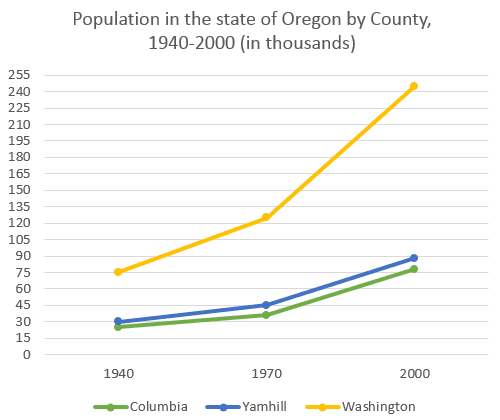
The given line graph illustrates the number of populations in three
counties
of Oregon, one of the US states, from 1940 to 2000. [The Use synonyms
counties
are divided into Use synonyms
Columbia
, Use synonyms
Yamhill
,and Washington.]
Use synonyms
Overall
, It is obvious that Washington had far more inhabitants than Linking Words
Yamhill
and Use synonyms
Columbia
Use synonyms
counties
throughout the period. Use synonyms
However
, these three Linking Words
counties
shared the same increasing trends. The increases were particularly obvious after 1970.
In 1940, The populations in Washington were approximately 75,000 Use synonyms
people
. After that, the county experienced a drastic growth until 1970, with nearly 120,000 Use synonyms
people
residing. Use synonyms
Moreover
, in 2000, the number rocketed to reach a peak of 245,000 Linking Words
people
.
Use synonyms
Columbia
and Use synonyms
Yamhill
Use synonyms
counties
followed a similar pattern, with Use synonyms
Yamhill
slightly surpassing in numbers, starting at around 25,000 and 30,000 Use synonyms
people
, respectively. The populations in both Use synonyms
counties
rose gradually until 1970, Use synonyms
then
rose dramatically to finish at about 60,000 Linking Words
people
for Use synonyms
Columbia
and 90,000 Use synonyms
people
for Use synonyms
Yamhill
.Use synonyms