
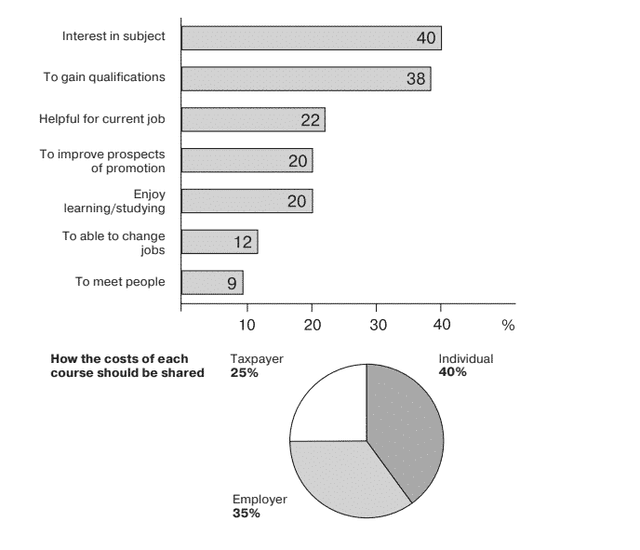
The charts indicate the results of the survey on adult education. The bar chart illustrates the reason why the adults would like to
study
, and a bunch of adults want to Use synonyms
study
because of their interest in subjects. Use synonyms
Moreover
, some Linking Words
people
want to Use synonyms
study
for socializing. The pie chart depicts Use synonyms
people
's opinions about the cost-sharing of adult education. The number of Use synonyms
people
who argue the cost Use synonyms
have
to be charged for individuals accounted for the major part.
The rate of Change the verb form
has
people
who want to Use synonyms
study
because of their interest and who obtain qualifications recorded 40% and 38%, respectively. Use synonyms
Furthermore
, 22% of Linking Words
people
replied they want to Use synonyms
study
since it is helpful for their current occupation. The rate of Use synonyms
people
who have a purpose for improving their prospects or promotion and enjoying learning was recorded at less than 15%.
Some Use synonyms
people
think the expense of adults' education should be divided. Those Use synonyms
people
figured a total of 60%. 35%of Use synonyms
people
thought it should be split with the employer, and 25% of Use synonyms
people
argued that the taxpayers have to help pay together.Use synonyms