
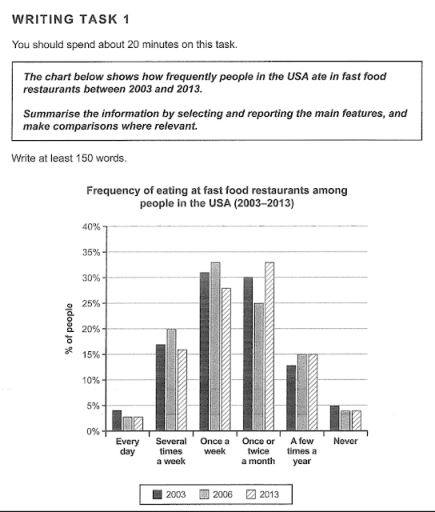
The chart
compare
the frequency of the proportion of locals who ate in Change the verb form
compares
the
fast Correct article usage
apply
food
restaurants in 2003 2006 and 2013.
Use synonyms
It is clear that
the number of people who ate fast Linking Words
food
once a week was the most in 2003 and 2006, Use synonyms
Linking Words
however
the figure of who ate once or twice a month became the most Add a comma
however,
one
in 2013. The people ate fast Correct pronoun usage
apply
food
Use synonyms
everyday
and the people Replace the word
every day
never
ate fast Correct pronoun usage
who never
food
Use synonyms
were stay
at a stable level during Wrong verb form
stayed
this
period.
The percentage of the consumers who had meals at fast Linking Words
food
Use synonyms
Use synonyms
restaurant
once a week increased from around 31% to 33% between 2003 and 2006. Fix the agreement mistake
restaurants
Linking Words
However
there was a decrease to 27% in 2013. Add a comma
However,
By contrast
the figure of those who enjoyed Linking Words
Use synonyms
food
in fast Add an article
the food
food
Use synonyms
Use synonyms
restaurant
once or twice a month Fix the agreement mistake
restaurants
Linking Words
firstly
Change the word
first
reduce
to 25% from 30% in the period between 2003 and 2006 but it became the highest one in 2013 which is 33%.
For the residents who ate in fast Wrong verb form
reduced
food
Use synonyms
Use synonyms
restaurant
many times a week, the proportion stayed lower than 20% during the period. And the number of “ a few times a year “ had a sightly risen to 15% and stayed at a stable level. The proportion of those who eat at fast Fix the agreement mistake
restaurants
food
Use synonyms
Use synonyms
restaurant
Fix the agreement mistake
restaurants
everyday
and never had a negligible amount of Replace the word
every day
reducement
.Correct your spelling
replacement