
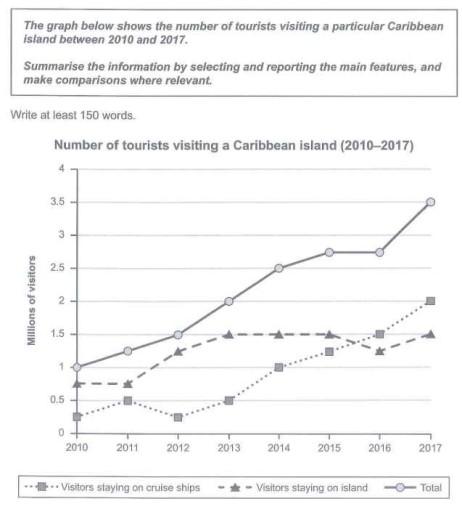
The line graphs present the
number
of visitors who visited the Caribbean islands between the years 2010 and 2017. The unit on the Y-axis is in Use synonyms
million
.
Use synonyms
According to
the picture, it can be seen that most tourists prefer to stay on the island until 2015, Linking Words
then
they change their decision by staying on cruise ships during their visit. Linking Words
Moreover
, the Linking Words
number
of tourists increased from 2010 to 2017.
In 2010 and 2011, the Use synonyms
number
of visitors who chose to stay on the islands accounted for nearly 0.7 Use synonyms
million
. There was a noticeable increase to roughly 1.3 Use synonyms
million
by 2012Use synonyms
,
after that slightly increased by 0.2 Remove the comma
apply
million
in the next year and plateaued at 1.5 Use synonyms
million
from 2013 to 2015. Fluctuating had been seen in 2016 and leveled off in 2017.
Use synonyms
On the contrary
, people roughly 0.2 Linking Words
million
decided to stay on cruise ships at the start of the period.
Use synonyms
In addition
, it shot up to 0.5 Linking Words
million
before slumping to the same Use synonyms
number
as in 2010 and back to the same Use synonyms
number
again at 0.5 in 2013. People staying on the ships after the year 2013 had become Use synonyms
a
remarkable notice and reached a peak of 2 Correct article usage
apply
million
in 2017.Use synonyms