
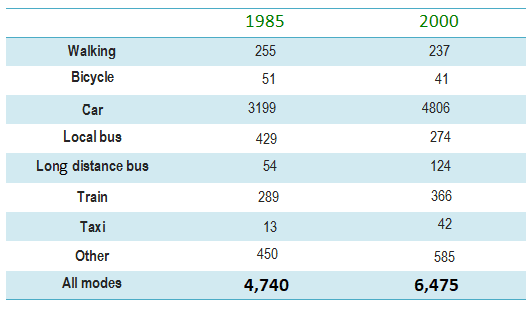
The given chart illustrates how the means of transportation changed in England over the 15-year period from 1985.
Overall
, we can see almost all vehicles had an upward trend except walking, bicycles and local buses had a downward trend. Car is the most used vehicle through 15 years but the taxi was lowest throughout the period. in
The number of cars was higher than in other sectors at 3199 in 1985 and went up one and a half times to 4806 in 2000 cars. Other Linking Words
transportations
and Fix the agreement mistake
transportation
train
Fix the agreement mistake
trains
also
climbed Linking Words
at
585 and 366 in 2000 respectively from 450 and 289 in 1985.
The number of walking vehicles dropped tediously to 237 from 255, Change preposition
to
whereas
the figure for local buses declined steeply Linking Words
at
274 in 2000 from 429 in 1985. And the figure for Change preposition
to
bicycle
went down steadily from 51 to 41 Fix the agreement mistake
bicycles
at the end
of the period.Linking Words