
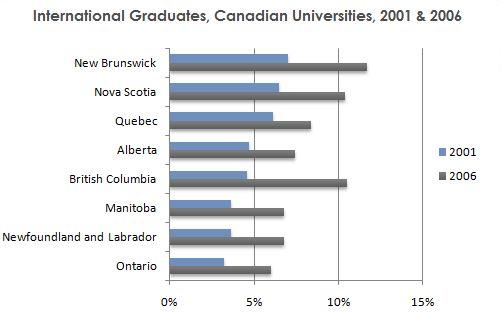
The bar graph depicts the proportion of international college students who graduated in various of Canada's provinces in 2001 and 2006.
Overall
, Linking Words
it is clear that
New Brunswick with the highest percentage in both 2001 and 2006. Linking Words
However
, Ontario's student numbers were the lowest in two different years. The other's ranking was basically the same in Linking Words
this
five-year period, but Linking Words
British
Use synonyms
Columbia
was the exception. An increasing trend can be observed in every category.
Looking at the graphs more closely, one can see that Quebec's figure gained only 2% in Use synonyms
this
period, and Linking Words
this
was the smallest growth. Both Mantibia and Newfoundland and Labrador had the same pattern in 2001 and 2006. Their numbers were almost the same. Students in Linking Words
British
Use synonyms
Columbia
rose about 7% in Use synonyms
this
report, and no other places had Linking Words
such
a significant increase. The sum of Alberta's pupils was at the same spot as Linking Words
British
Use synonyms
Columbia
's, but in 2006, Use synonyms
British
Use synonyms
Columbia
became the second highest in Use synonyms
this
survey which was approximately similar to Nova Scotia.Linking Words