
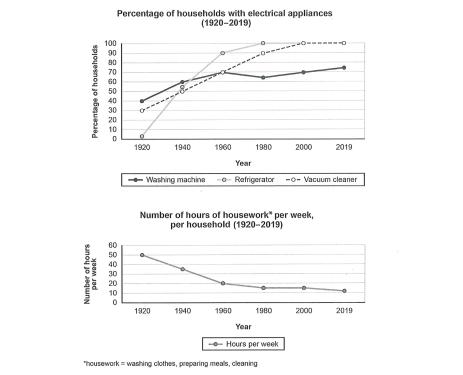
There are two charts presented, the above one shows the percentage of households with electrical appliances and the other one illustrates the number of
hours
of housework per Use synonyms
week
, per Use synonyms
household
in the Use synonyms
year
1920 to 2019. We can see that the sum of electrical appliances Fix the agreement mistake
years
Use synonyms
household
Change preposition
in household
ownerships
Fix the agreement mistake
ownership
had been
increased over the Wrong verb form
has
years
. The second chart informs us that the Use synonyms
hours
of housework per Use synonyms
week
had Use synonyms
been
gradually Verb problem
apply
descended
by nearly ten decades.
There are three tools mentioned, namely washing machine, refrigerator, and vacuum cleaner. We can see that the usage of vacuum Verb problem
decreased
cleaner
was constantly climbing from 30% in 1920 to 100% in 2000 and 2019. Fix the agreement mistake
cleaners
Whereas
the total of households Linking Words
installed
Correct pronoun usage
that installed
refrigerator
was nearly zero in the first data and exponentially increased until every Fix the agreement mistake
refrigerators
household
had Use synonyms
refrigerator
in 1980, it became constant after. Add an article
a refrigerator
the refrigerator
On the other hand
, washing Linking Words
machine
had a slight fluctuation in 1980. It slowly ascended and reached over 70% in the Fix the agreement mistake
machines
last
data.
In sharp contrast to Linking Words
this
, the data shows that 50 Linking Words
hours
were spent per Use synonyms
week
to do the chores manually in 1920. It gradually dropped as more Use synonyms
machine
Fix the agreement mistake
machines
used
over the Add a missing verb
were used
years
. The sum was unchanged between the Use synonyms
years
1980 and 2000. Use synonyms
Then
it decreased again to a little above 10% Linking Words
hours
per Use synonyms
week
in every Use synonyms
household
in the later 19 Use synonyms
years
.Use synonyms