
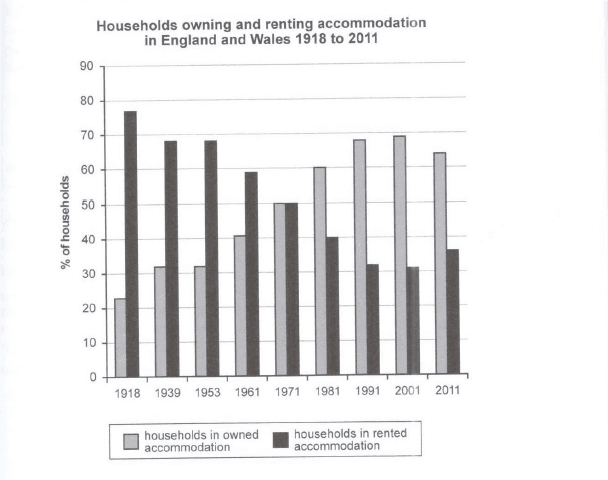
The bar chart gives data regarding the proportions of families who rented a house and bought an apartment in England and Wales over the course of 93 years between 1918 and 2011.
Units are measured in percentages
Overall
,what stands out from the graph is that Linking Words
while
the number of owned accommodations by households was Linking Words
initially
lower,it overtook the figure for the rented ones towards the middle of the period.
Looking into detail,just under four-fifths of families rented a house in 1918 and it decreased considerably until 1971 and in Linking Words
this
year,it was outnumbered by the figure for owned accommodation.Afterwards, it continued to decline until 2001 and during the rest of the period,it grew unexpectedly and stood at approximately one-third.
With regard to the owned ones,the share of families who owned houses was just above one-fifth in 1917 and it rose substantially until 2001 before declining marginally to a little more than 60%.Linking Words