
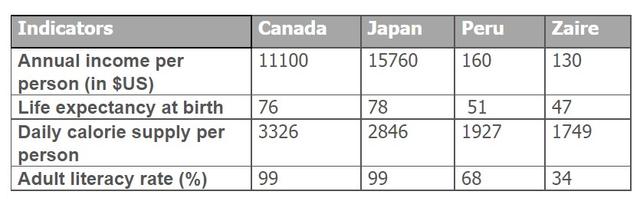
The given table graph compares four indicators (social and economic) in four different countries (Canada,
Japan
, Use synonyms
Peru
, and Use synonyms
Zaire
) year 1994.
Use synonyms
Overall
, it can clearly be seen that Linking Words
Japan
led in all four categories with the exception of daily calorie supply per person. Use synonyms
Moreover
, Linking Words
Zaire
was the lowest Use synonyms
on
all the measurements.
In terms of economics, the two lowest annual incomes were Change preposition
of
Peru
and Use synonyms
Zaire
which accounted for 160 and 130, respectively. Use synonyms
In contrast
, Canada’s at 11100 and Linking Words
Japan
’s at 15760 yearly earnings were more than 30 times of Use synonyms
Peru
and Use synonyms
Zaire
combined.
Regarding the other three indicators, which are social scales, life expectancy in Use synonyms
Japan
surpassed Canada with only a slight difference Use synonyms
by
2 points Change preposition
of
while
it was 27 with Linking Words
Peru
and 31 with Use synonyms
Zaire
. Use synonyms
Japan
and Canada only had a few gaps in daily calorie supply per person (3326 vs 2846) and had the exact same number in adult literacy rate at 99%. These two categories had Use synonyms
Zaire
as the lowest number at 1749 for calorie consumption and 34% only for adults with literature.Use synonyms