
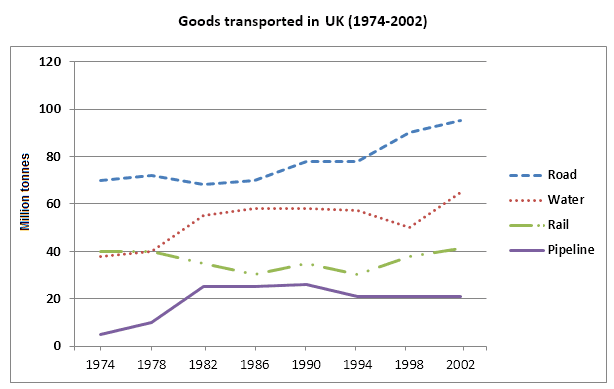
The line graph illustrates the number of merchandise delivered by the different modes of goods
transportation
in the UK in a 32-year Use synonyms
period
, starting from 1974. The types of Use synonyms
transportation
are categorized as Use synonyms
road
, Use synonyms
water
, Use synonyms
rail
and Use synonyms
pipeline
. Use synonyms
Overall
, it can be seen that all the Linking Words
transportation
experienced upward trends throughout the provided Use synonyms
period
.
Use synonyms
Initially
, in 1974, Linking Words
road
and Use synonyms
rail
started with over 40 Use synonyms
million
Use synonyms
tonnes
Between 1978 and 1990, the Use synonyms
road
fluctuated to just under 80 Use synonyms
million
Use synonyms
tonnes
, and remained steady until 1994. After there, it rose gradually, reaching its peak at around 95 Use synonyms
million
Use synonyms
tonnes
, in 2002. Use synonyms
Similarly
, Linking Words
rail
Use synonyms
also
witnessed varied directions over the Linking Words
period
. Use synonyms
However
, it finished just slightly over the beginning of the Linking Words
period
number.
Use synonyms
Conversely
, Linking Words
water
and Use synonyms
pipeline
commenced with a lower number compared to Use synonyms
road
and Use synonyms
rail
(under 40 Use synonyms
million
Use synonyms
tonnes
). Both showed a drastic increase in the first 8-year Use synonyms
period
, with roughly 60 Use synonyms
tonnes
for Use synonyms
water
, and 25 Use synonyms
million
Use synonyms
tonnes
for Use synonyms
pipeline
, and maintained at their level. After that, these two Use synonyms
transportation
dropped minimally. Use synonyms
Then
, the Linking Words
water
rose to approximately 65 Use synonyms
million
Use synonyms
tonnes
, Use synonyms
while
the Linking Words
pipeline
level out until 2002.Use synonyms