The graph shows the number of visitors to four international museums between 1980 and 2015. Summarise the information by selecting and reporting the main features, and make comparisons where relevant.
IELTS Writing Task Chart for The graph shows the number of visitors to four international museums between 1980 and 2015. Summarise the information by selecting and reporting the main features, and make comparisons where relevant.
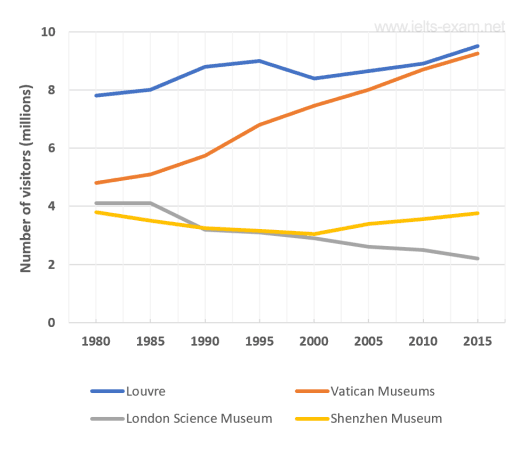
The line graph compares the number of people who visited
in
Change preposition
apply
show examples
four international museums in 35 years period, between 1980 to 2015.
Overall
Linking Words
, the
napatnp18065322
Unauthorized use and/or duplication of this material without express and written permission from this site's author and/or owner is strictly prohibited. Excerpts and links may be used, provided that full and clear credit is given to Writing9 with appropriate and specific direction to the original content.
Sentences: Add more complex sentences.
▼
Linking words: Add more linking words.
▼
Basic structure: Write more paragraphs.
▼
Basic structure: Add more body paragraphs.
▼
Common mistake: Your writing should be 150-250 words.
Basic structure: Write more paragraphs.
▼
Vocabulary: Rephrase your introduction. Words match: 75%.
▼
Vocabulary: Rephrase the word "number of" in your introduction.
▼
Vocabulary: Only 3 basic words for charts were used.
▼
Vocabulary: Use several vocabularies to present the data in the second paragraph.
In the globalized world, consumers worldwide can buy food and products made from all over the world. This development is indeed a large breakthrough at the current time because people can taste other nations' cuisine. This essay demonstrates the negative and positive impacts of this development, however, I believe that this is a positive trend.
I am writing to express my heartfelt gratitude for your help after the accident. Your kindness and support have made a significant impact on me, and I want to take a moment to convey my sincere thanks.
In recent times, due to high pressure from employers on employees at the workplace. So, a number of people think that the, working days should be shorter and the weekend time should be longer as compared to the current time. I agree with this viewpoint because they can spend quality time with their family.
Over the last few decades, the majority of individuals' work has been easier compared to past times due to the development of novel technological advancements. Subsequently, this improvement has been affected drastically people's lives. I partially agree with this idea that it has both negative and positive implications in today's lifestyles.
I hope you're doing absolutely fantastic! I am beyond thrilled while I'm writing this letter to inform you that I discontinued my previous place and received a new work opportunity.