
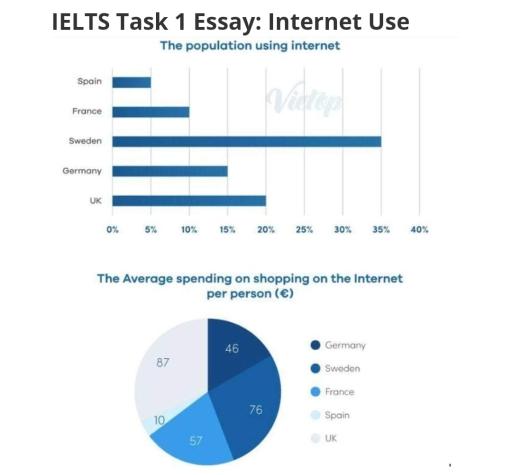
The bar chart shows information about the usage of the
Internet
in five European countries in 2000, namely Spain, France, Use synonyms
Sweden
, Germany, and the Use synonyms
UK
. The bar chart was measured in percentages. Meanwhile, the pie chart shows the average expenditure for shopping using the Use synonyms
Internet
per person, which was measured in Use synonyms
euros
. Use synonyms
Overall
, Linking Words
Sweden
had the highest percentage of users, and the Use synonyms
UK
had the highest average spending on the Use synonyms
Internet
.
Looking at the bar charts, Use synonyms
Sweden
had the highest proportion of Use synonyms
internet
users, with over a third of the total population, followed by the Use synonyms
UK
(20%), Germany, and France by 15% and 10%, respectively. Meanwhile, Spain had the lowest percentage, only 5%.
Turning to the pie charts, the lowest spending on the Use synonyms
Internet
was Use synonyms
Spain
, at only 10 Change preposition
in Spain
euros
. Germany spent 46 Use synonyms
euros
, and France spent 57 Use synonyms
euros
. Use synonyms
Next,
Linking Words
Sweden
and the Use synonyms
UK
spent 76 Use synonyms
euros
and 87 Use synonyms
euros
respectively.Use synonyms