
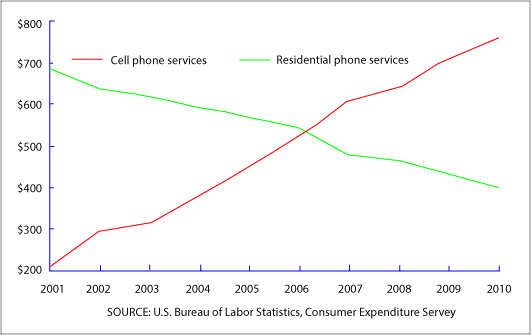
The line graph illustrates the average money per year
that is
spent on cell Linking Words
phone
Use synonyms
services
and residential Use synonyms
phone
Use synonyms
services
in 10 years starting from 2001 to 2010. The unit on the Y-axis is shown in dollars.
Use synonyms
According to
the figures, Linking Words
it is clear that
the trends of both Linking Words
services
are reversed. Use synonyms
While
the expenditure on mobile phones rises throughout the period, the home Linking Words
phone
drops.
On the one hand, the mobile Use synonyms
phone
started at well over $200 Use synonyms
then
steadily increased to reach a peak at nearly $720 in 2010. Linking Words
However
, minimal climbings were seen in two periods of time which between 2002 to 2003, registered $310, and 2007 to 2008, represented $650.
Linking Words
On the other hand
, the house line Linking Words
services
began at just under $700 in 2001 and continuously decreased to almost $400 in 2010. There were two noticeable nosedives which were from 2001 to 2002 and 2006 to 2007, which were about $650 and $480 respectively.Use synonyms