
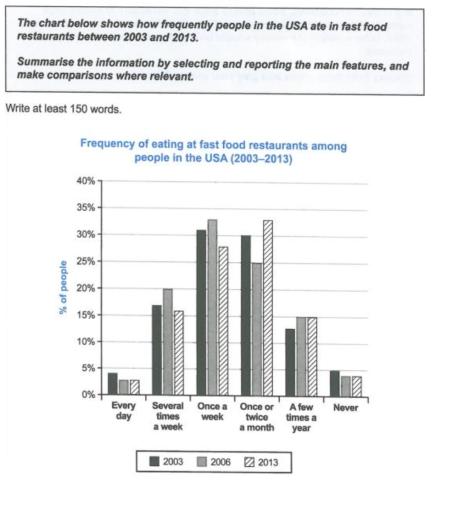
The bar chart provided information regarding the frequency of eating junk food at restaurants among the USA citizens from 2003 to 2013.
Overall
, Linking Words
it is clear that
the highest proportion of fast-food consumption was once a week and once or twice a month throughout the period. Linking Words
On the other hand
, people who never ate and who consumed it daily represented the smallest rates.
In 2003 and 2006, there were approximately 31% and 33% of consumers visited the outlets "once a week" and "once or twice a month", respectively. Linking Words
However
, it had significantly decreased seven years later to about 28%. Linking Words
Subsequently
, at the level of "once or twice a month", it experienced a decline from 30% to 25% in the first period, and Linking Words
then
drastically increased to 33%.
Linking Words
Furthermore
, the Americans who ate "several times a week" witnessed a fluctuative range of 15% to 20%. Linking Words
Besides
, there were only 10% to 15% of groups "a few times a year". The lowest number of consumers was under 5% who ate daily and never consumed the food at all.Linking Words