
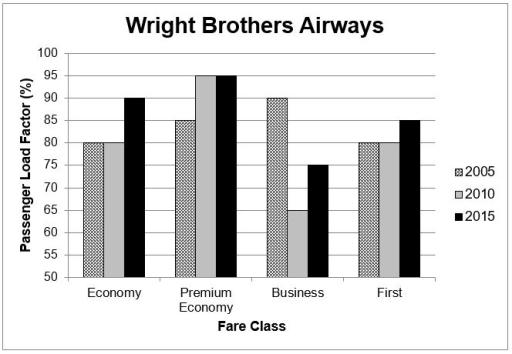
The graph depicts the occupancy of seats of the Wright Brothers Airways, separated into 4 fare classes between 2005 , 2010 and 2015.
Overall
, the Premium Economy Linking Words
class
has the highest number of seats filled, Use synonyms
whereas
the Business Linking Words
class
has the lowest. Use synonyms
Likewise
, all the different classes experienced an upward trend except the Business Linking Words
class
, which encountered a downward tendency, most of the time of the period given .
From 2005 to 2010 , Economy and First Use synonyms
class
remained stable with an equal number of chairs, which represented 80%, Use synonyms
while
in 2015 , it rose respectively to 90% and 85%. Linking Words
In addition
, the Premium economy had a significant rise, peaking at 95% in both years 2010 and 2015.
Linking Words
However
, Business Linking Words
class
dropped sharply in 2010 to 65% , even if it rose again to 75% in 2015, which still represented the lowest rate of seats compared to the othersUse synonyms