
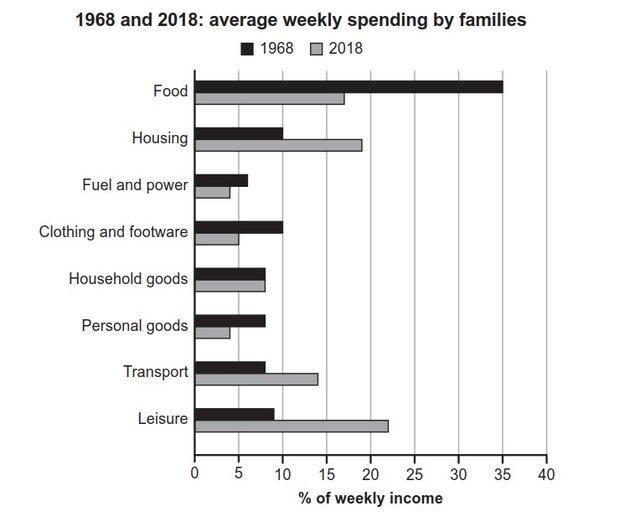
The bar chart provides key information about the weekly expenditure for families in one region between 1968 to 2018.
Overall
, it is clear from the graph that the highest spending for families was on food. Linking Words
In addition
, in 1968 they spent almost on goods than in 2018, Linking Words
whereas
in 2018 they spent wan on leisure.
Linking Words
According to
what is shown, in 1968 food expenditure had a significant increase at the peak of 35%, families spent on clothing and footwear around 10 per Linking Words
cent
, Use synonyms
while
they showed a decline on spent on housing by approximately 10 Linking Words
cent
. transport and leisure showed a similar decrease of nearly 9 per Use synonyms
cent
.
In terms of, family expenditure in 2018, leisure was the most significant part over the period at the top of 23 per Use synonyms
cent
, Use synonyms
while
food showed an insignificant decrease to half compared to 1968. Linking Words
While
transport showed a higher ratio than in 1968 almost 15 per Linking Words
cent
. Use synonyms
However
, household goods were equivalent Linking Words
overall
the period, other goods had almost the same percentages about 5 per Linking Words
cent
.Use synonyms