
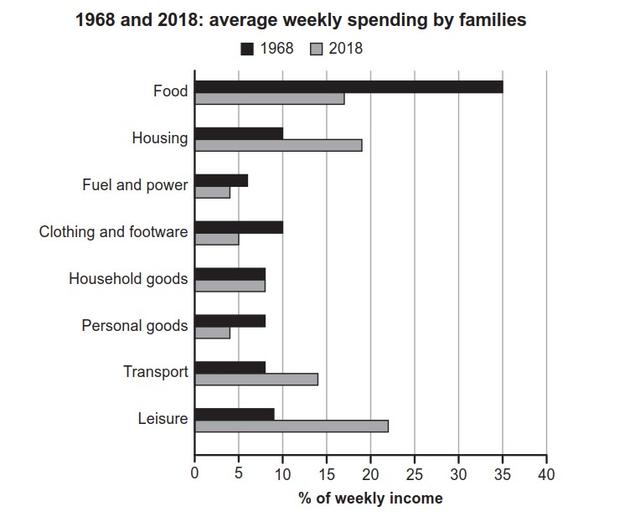
The pie graph illustrates the percentage of
weekly
budget that families in one country Add an article
the weekly
pay out
on eight various parts of life in 1968 and 2018.
Correct your spelling
payout
Overall
, in 1968 the most amount of money Linking Words
people’s
expenditure was on food, Change noun form
people
while
the least part of their budget was spent on fuel and power. In 2018 people prefer to Linking Words
spent
most of their income on leisure, Change the verb
spend
whereas
the least shared between personal goods and fuel and power.
Linking Words
According to
the chart, the percentage of income spent on food reduced from 35% to around 17% over the entire time period, the same trend experienced clothing and Linking Words
footware
and personal goods, there was a decrease from 10% to 5% and from around 8% to 4%, respectively. Spending on fuel and power fell slightly by 2% in 2018. Correct your spelling
footwear
However
, the figures for household goods remained the same throughout the period.
Linking Words
In contrast
, there was a significant increase in figures for leisure from approximately 9% in 1968 to 23% in 2018. Linking Words
Then
the percentage spent on housing experienced the same pattern and rose by 9%, followed by transport from 8% to 14% during the provided time period.Linking Words