
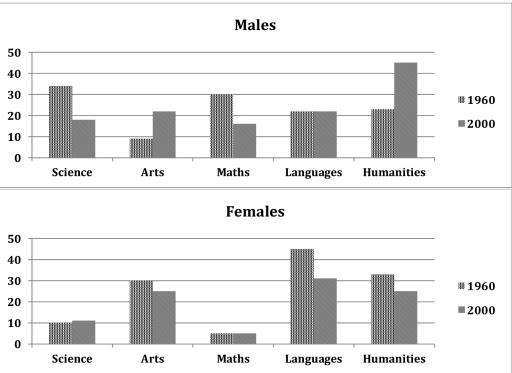
The table illustrates the number of learners as boys and girls with high marks in 1960 and 2000.
Overall
, the males always had good results in science and maths both in two years, Linking Words
however
, the females were better in arts and languages. Linking Words
Also
, girls mostly had decreased grades compared with the marks of some decades period, meanwhile, the boys had raised their knowledge.
Males were leaders in technical subjects and maths by having 30 or more graduates in the 1960s. Linking Words
In addition
, in the 2000s the same disciplines had bigger results than girls, except for the percentage falling under 20. They were not good at arts in the 1960s, Linking Words
nevertheless
,after forty years guys became 21% in arts and got first place in humanities.
Females had trouble with Mathematics and science, Linking Words
therefore
their per cent that counts approximately less than 11 for two different ages in science, Linking Words
additionally
5% per era in maths was the worst result. Mostly, female students had a downward trend in languages and humanities in the 2000s by getting under 30 even if they were the best ones in Linking Words
this
category about half a century ago.Linking Words