
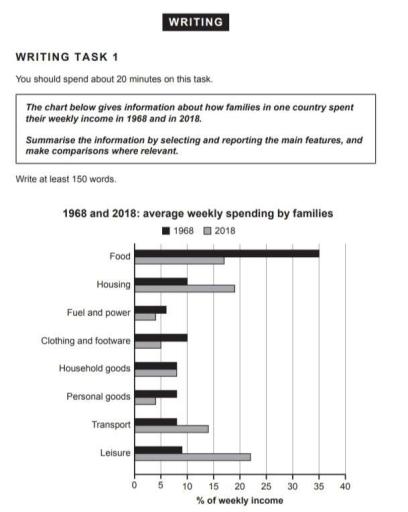
The bar graph illustrates the average weekly spending by families in an unspecified state from 1968 to 2018.
Overall
, it is noticed that Linking Words
spendings
on food was the highest in the first given year Fix the agreement mistake
spending
while
other disburses were low. In 2018, leisure ranked Linking Words
the
top of the list. Notably, families tended to spend the least amount of expenditures on fuel and power throughout the period shown.
In 1968, families spent roughly a third of their income on food, making it far higher than housing and clothing and footwear at 10%. Other options, Change preposition
at the
such
as leisure, transportation, personal goods and household goods had a similar trend, being just under Linking Words
tenth
.
In 2018, leisure led the majority of the proportions at almost a quarter. Housing ranked Add an article
a tenth
the
second at approximately 18%, followed by edibles accountingCorrect article usage
apply
a
total of Change preposition
for a
closely
to 17%. Change the word
close
In contrast
, fuel Linking Words
and
power and personal items constitute a mere 4%. Correct word choice
apply
Moreover
, clothing and footwear dropped to half during the period, reaching 5%, Linking Words
whereas
household products remained constant throughout the years at nearly 8%.Linking Words