The bar chart below shows estimated world illiteracy rates by region and by gender for the last year. Summarise the information by selecting and reporting the main features, and make comparisons where relevant.

The bar chart below shows estimated world illiteracy rates by region and by gender for the last year.

Summarise the information by selecting and reporting the main features, and make comparisons where relevant.
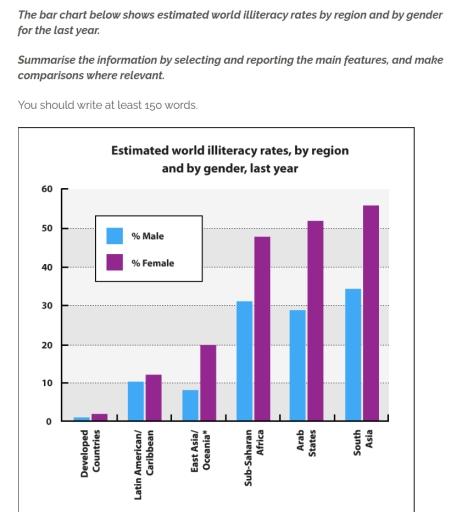
The following illustration shows the percentages of illiterate
people
people
according to
the regions that they live,
and
Change preposition
in and
show examples
their gender.
Overall
, we can observe the least
number
of illiterate
people
live in developed
countries
and the highest
number
of them live in South Asia.
Also
, it is worth mentioning that the
number
of illiterate females is higher than males in each mentioned region. In developed
countries
Add a comma
countries,
show examples
the percentage of illiterate males and females is less than 10%, unlike
to
Change preposition
in
show examples
South Asia, Arab states,
Sub-Saharan
Correct word choice
and Sub-Saharan
show examples
Africa. In these
countries
Add a comma
countries,
show examples
percentages of illiterate
people
are way higher than 10 percent.
However
, in East Asian
countries
and
Oceania
Add a comma
Oceania,
show examples
the
number
of illiterate men is quite low approximately 7%,
although
the percentage of women
makes
Verb problem
is
show examples
around 20%. The same trend has repeated with Latin American and Caribbean
countries
, where the percentage of males makes up exactly 10% of the population and around 15% of females are illiterate
Submitted by intiqam.hasanov on

Unauthorized use and/or duplication of this material without express and written permission from this site’s author and/or owner is strictly prohibited. Excerpts and links may be used, provided that full and clear credit is given to Writing9 with appropriate and specific direction to the original content.

Sentences: Add more complex sentences.
Introduction: The introduction is missing.
Introduction: The chart intro is missing.
Vocabulary: Replace the words people, number, countries with synonyms.
Vocabulary: Rephrase the word "shows" in your introduction.
Vocabulary: Only 6 basic words for charts were used.
Vocabulary: The word "number of" was used 4 times.
Vocabulary: The word "percentages" was used 5 times.
Vocabulary: The word "around" was used 2 times.
Topic Vocabulary:
  • Illiteracy rates
  • Region
  • Gender disparity
  • Bar chart
  • Estimated
  • Summarise
  • Main features
  • Comparisons
  • Analyzing
  • Discrepancies
  • Significant
  • Pronounced
  • Speculation
  • Male
  • Female
  • Global perspective
  • Literacy
  • Educational attainment
  • Socio-economic factors
  • Cultural influences
What to do next:
Look at other essays: