
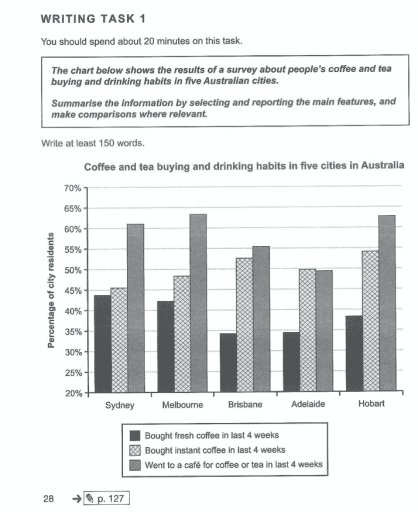
The bar chart illustrates the summary of a survey in percentages regarding the
behavior
of Change the spelling
behaviour
coffee
and tea purchases and consumption in five cities in Australia.
Use synonyms
Overall
, Linking Words
it is clear that
most people have preferred to go to a cafe for Linking Words
coffee
or tea in the Use synonyms
last
4 weeks. Linking Words
On the other hand
, fresh Linking Words
coffee
was a less popular type of drink to buy among the others.
Use synonyms
To begin
with, Melbourne had the most consumers who visited a cafe. There were approximately 64% of people, followed by Hobart and Sydney at 62% and 61%, respectively. Linking Words
Subsequently
, Brisbane had a lower percentage than these cities with 56%. Linking Words
Moreover
, Adelaide was the area that had the lowest rates with 49% since the citizens are more likely to buy instant Linking Words
coffee
.
Use synonyms
Furthermore
, instant Linking Words
coffee
was the second-ranked choice by city residents, excluding Adelaide. In Hobart, there were about 54% of consumers Use synonyms
who
liked instant Correct pronoun usage
apply
coffee
, followed by Brisbane at 53%, Adelaide at 50%, Melbourne at 28%, and Sydney at 45% as the lowest percentages. Use synonyms
Lastly
, fresh Linking Words
coffee
had the least choice around 34% to 45% in all of the cities.Use synonyms