
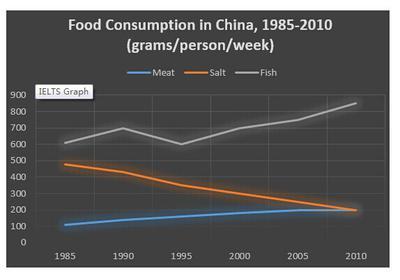
The line chart illustrates the portion of food that China's citizens ate from 1985 to 2010.
Overall
, there was a slight increase in meat consumption over the years, Linking Words
while
there was a drastic decrease in salt use. Linking Words
On the other hand
, the number of fish that was served in households was quite fluctuating.
Based on the given statistic, each person ate only 100 grammes of flesh per week in 1985. Linking Words
Furthermore
, Linking Words
this
ratio gradually inclined to less than twice in 2010. Reversely, there was a huge quantity of salt and fish eaten at the beginning of the study, each at 500 grammes and 600 grammes, respectively. Albeit Linking Words
this
rate is quite high, people Linking Words
then
gently digest less natrium in the next few decades, down to the exact same point as the meat Linking Words
at the end
of the research. Linking Words
This
condition was widely different from fish consumption, which fluctuated through time. For a quarter of a century, the inhabitants constantly consumed more protein from water than from any other source.Linking Words