
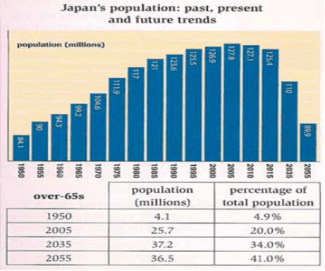
The bar illustrates the
number
of people in Japan with five-year intervals from 1950 through a projection of 2055 and the table presents the Use synonyms
number
and proportion of people over 65 years old in four years comprising 1950, 2005, 2035 and 2055.
Use synonyms
Overall
, Linking Words
it is clear that
the Linking Words
Japanese
population Use synonyms
increases
before dropping to almost the same Wrong verb form
increased
number
as in the early Use synonyms
of
Change preposition
apply
the
period. Correct article usage
apply
Moreover
, elders whose age is more than 65 are predicted to be highest in 2055 Linking Words
Japanese
society.
Use synonyms
To begin
with, the Linking Words
number
of Use synonyms
Japanese
citizens in 1950 was about 84.1 before escalating to reach a peak at 127.8 in 2005, Use synonyms
however
, it slightly declined to 125.4 in 2015. The remarkable decrease is predicted to 110 in 2035 and Linking Words
then
it will nosedive again to 89.9 in 2055.
Linking Words
Additionally
, the elderly community represented 4.1 which was about 4.9% of total Linking Words
Japanese
people. Fifty-five years later, the total of the old community surged to 25.7 and it was exactly one-fifth of the population. In 2035, it will soar to 37.2 and 34%, Use synonyms
on the contrary
, the Linking Words
number
of elders fall to 36.5 but the percentage still shoot up to 41% in 2055.Use synonyms