
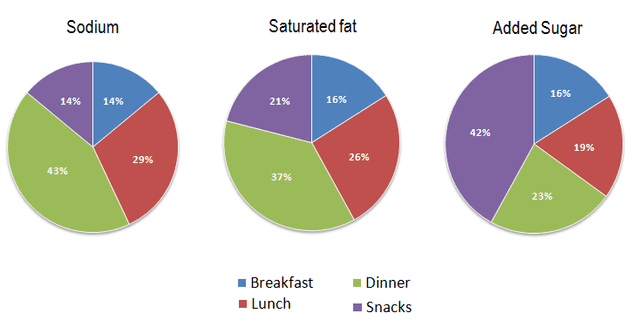
The pie charts illustrate the average proportion of four fat and added
sugar
nutrition sectors available.Use synonyms
Sodium
and Saturated fat affect more in Use synonyms
dinner
Use synonyms
meals
.Use synonyms
while
eating too many snacks becomes unhealthy because of added Linking Words
sugar
.
Use synonyms
Moreover
,a significant amount of Linking Words
dinner
meal added Use synonyms
sodium
and Saturated fat by 42% and 37% respectively.Use synonyms
Furthermore
, snacks and breakfast Linking Words
meals
remain the same proportion of 14%.Use synonyms
In addition
, other saturated nutrients through 21% and 16% .over the quarter of proportion is made up of lunch from Linking Words
sodium
and Saturated fat.
Use synonyms
However
, in added Linking Words
sugar
, the most considerable percentage is under a half-eaten snack meal.Approximately just below a quarter percentage by Use synonyms
dinner
meal.Breakfast was Use synonyms
also
16% and lunch decreased their percentage. Linking Words
Sodium
and Saturated fat were eaten in Use synonyms
dinner
Use synonyms
meals
and more snack Use synonyms
meals
were eaten people were in unhealthy conditions because of the added Use synonyms
sugar
to their Use synonyms
meals
.Use synonyms