
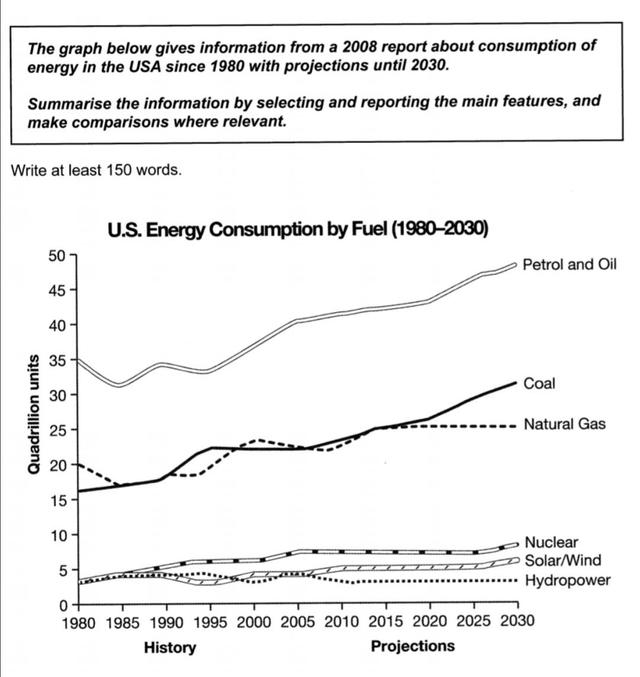
What has been depicted in the line graph is the consumption of energy in the United States in 1980 and
to be
anticipated in 2030. Change the verb form
is
Overall
, throughout the whole time frame, petrol and oil had the highest portion among the other consumed energy, Linking Words
whereas
that of hydropower was the lowest.
From 1990 to 2020, petrol and oil showed a rising trend, ranging from 35 Linking Words
quadrillion
to 45 Use synonyms
quadrillion
, and it is estimated that it will increase 50 Use synonyms
quadrillion
Use synonyms
at the end
of the period. Linking Words
Moreover
, at the beginning of the period, coal and natural gas followed an almost similar pattern, starting at 20 and 16 quadrillions respectively, and finishing at around 25 quadrillions in 2020. Linking Words
In addition
, it is predicted that the former will continue its trend, which is nearly 30 Linking Words
quadrillion
, Use synonyms
while
the latter will remain unchanged at 25 Linking Words
quadrillion
.
Over the given period, nuclear, solar/wind, and hydropower started at around 4 Use synonyms
quadrillion
, with nuclear at the top, followed by solar and wind at around 5 Use synonyms
quadrillion
in 2010. Both are projected to reach around 6 and 9 Use synonyms
quadrillion
by 2030 in order, Use synonyms
while
hydropower experienced a slight drop and it is projected that it will fall below the initial values.Linking Words