
The
provided
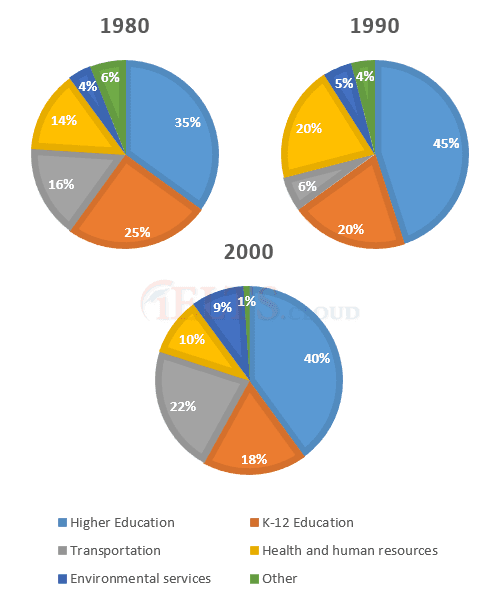
pie chart shows the components of annual spending by local government entities in Someland in 1980,1990 and 2000.
The information is categorised into six sections which consist of Higher Verb problem
apply
education
, K-12 Use synonyms
education
, transportation, environmental services, health and human resources and Others. Use synonyms
Also
, they are presented in blue, orange, grey, navy, yellow and green respectively.
Linking Words
Overall
, the all-time biggest portion was the higher Linking Words
education
costs. It increased from 35% in 1980 to 45% in 1990, Use synonyms
then
it decreased to 40% in 2000. Linking Words
In addition
, the spending on K-12 Linking Words
education
was the second highest group. Use synonyms
However
, it continuously went down from 25% in 1980 to 18% in 2000. Obviously, it was on a downward trend. Linking Words
Moreover
, the health and human resources fluctuated during the period. It rose from 14% in 1980 to 20% in 1990. After that, it significantly dropped to 10% in 2000. Linking Words
On the other hand
, the transportation fees sharply dropped from 16% in 1980 to 6% in 1990 and they dramatically went up to 22% in 2000. Linking Words
Lastly
, environment services and others remained in the low-spending group as the percentages were less than 10%.Linking Words