
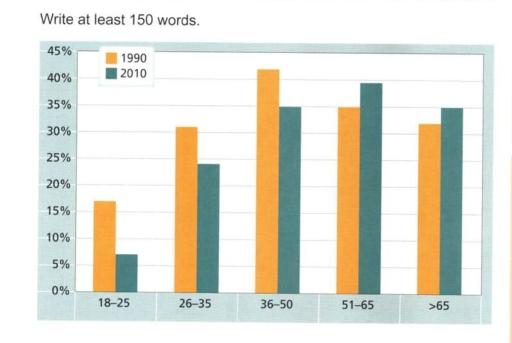
The bar chart provides the data in the ratio of British
people
who donate money to non-profit organisations by Use synonyms
age
group between 1990 and 2010.
Use synonyms
Overall
, it is clear from the graph that the donation rate considerably increased among five different Linking Words
age
groups of Use synonyms
people
from 18 to 65+ between 1990 and 2010. The highest ratio was 36-50 years individuals in 1990, Use synonyms
while
the 18-25 Linking Words
age
group Use synonyms
people
were placed at the lowest position in 2010. Use synonyms
However
, the contribution of elderly citizens, aged 51 to 65+ , gradually increased in 2010 compared to 1990.
In 1990, among individuals aged 18 to 50 years, the contribution percentage rapidly escalated, which was just over 15, approximately 30, and above 40, respectively, Linking Words
whereas
Linking Words
this
ratio dramatically rose in 2010, Linking Words
accordingly
, almost above 5, nearly below 25, exactly 35, as well. Linking Words
Although
Linking Words
,
the portions in 2010 were significantly smaller than in 1990. Middle-aged Punctuation problem
apply
people
(36-50) donated the largest amount to the organization around 40% in 1990, compared to the early younger public (18-25), who provided the smallest number , more than 5% in 2010.
Use synonyms
Nevertheless
, there was a decrease shown in the 50 to over 65 Linking Words
age
groupUse synonyms
,
Add a semicolon
;
however
, comparing to others , Linking Words
this
time in 2010 followed the opposite trend and gave a greater amount than in 1990, which were nearly 40%, and almost 35%, respectively.Linking Words