
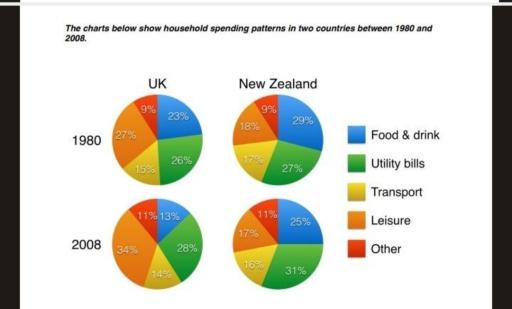
The four pie charts compare how households in the UK and New Zealand distributed their expenditure across five categories in 1980 and 2008.
Overall
, Linking Words
leisure
accounted for the largest proportion of household spending in the UK, Use synonyms
while
Linking Words
food
and drink Use synonyms
initially
dominated in New Zealand before being overtaken by Linking Words
utility
Use synonyms
bills
. In both countries, spending on utilities and other expenses increased, Use synonyms
whereas
transport experienced a slight decline.
In 1980, British households allocated 27% of their budgets to Linking Words
leisure
, followed closely by Use synonyms
utility
Use synonyms
bills
at 26% and Use synonyms
food
and drink at 23%. By 2008, Use synonyms
leisure
had risen considerably to 34%, becoming even more dominant. Use synonyms
Utility
Use synonyms
bills
Use synonyms
also
increased slightly to 28%, Linking Words
while
Linking Words
food
expenditure dropped significantly to 13%.
Use synonyms
In contrast
, New Zealand households spent the largest share on Linking Words
food
and drink in 1980, at 29%, compared with 27% on utilities. By 2008, Use synonyms
utility
Use synonyms
bills
had climbed to 31%, overtaking Use synonyms
food
, which fell to 25%. Meanwhile, Use synonyms
leisure
spending decreased marginally from 18% to 17%, and transport declined by one percentage point in both countries.Use synonyms