the charts below show the proportions of British students at one university in England who were able to speak other languages in addition to English, in 2000 and 2010

the charts below show the proportions of British students at one university in England who were able to speak other languages in addition to English, in 2000 and 2010
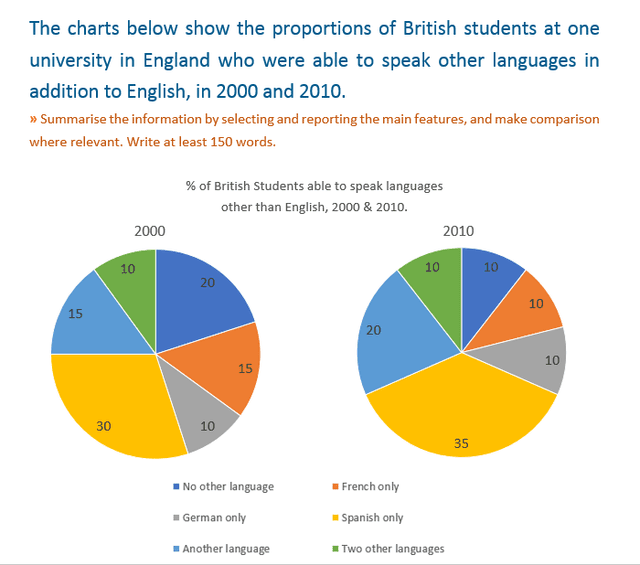
The pie charts illustrate the percentage of British students in England at a University who know to speak other languages apart from English in the
year
Fix the agreement mistake
years
show examples
2000 and 2010.
Overall
, Spanish was the highest spoken language in both the years,
while
the minimum speaking was German for both the years. The number of students who can speak Spanish
were
Change the verb form
was
show examples
30% in 2000 and has increased by 5% by 2010 and it remained the highest spoken language.
However
, the combined
percent
Change the spelling
per cent
show examples
of pupils who can converse in another and two other languages was 25% in 2000, which has increased by 5% in each language by 2010 with a total of 35%.
Whereas
, pupils who cannot speak anything other than English were 20% in 2000, and by 2010 the count decreased to 10%. The
novice
Fix the agreement mistake
novices
show examples
who can converse in German were only 10% in both the given years.
Moreover
, pupils who can communicate in French were 15% in 2000, which
has
Unnecessary verb
apply
show examples
decreased by 5% in 2010.

Unauthorized use and/or duplication of this material without express and written permission from this site’s author and/or owner is strictly prohibited. Excerpts and links may be used, provided that full and clear credit is given to Writing9 with appropriate and specific direction to the original content.

Sentences: Add more complex sentences.
Vocabulary: The word "decreased" was used 2 times.
Vocabulary: The word "increased" was used 2 times.
Vocabulary: Use several vocabularies to present the data in the second paragraph.
Topic Vocabulary:
  • proportions
  • British students
  • university
  • speaking other languages
  • language proficiency
  • overall trends
  • comparison
  • 2000
  • 2010
  • chart
  • data
  • percentage
  • significant
  • increase
  • decrease
  • noteworthy
  • comparative analysis
  • improvement
  • decline
  • conclusion
What to do next:
Look at other essays: