
This
Line Linking Words
graph
Use synonyms
visualise
the Change the verb form
visualises
number
of people Use synonyms
traveling
Change the spelling
travelling
in
Change preposition
to
underground
station in London which Add an article
an underground
also
Linking Words
shocase
additional Correct your spelling
showcase
informations
comprises with it.
Usually, the Line Change the wording
information
pieces of information
graph
Use synonyms
have
two relative Change the verb form
has
aspect
of the data. Change to a plural noun
aspects
Likewise
, here Linking Words
also
they took Linking Words
Correct article usage
the passengers
passengers
count and the Fix the agreement mistake
passenger
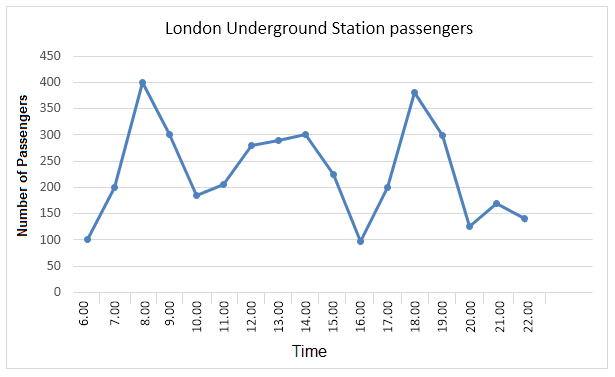
Time
from 6:00 to 22:00 which shows the Use synonyms
number
of people travel in the particular Use synonyms
time
. These passengers Use synonyms
number
was take in underground station of London. At 8:00, There were around 400 people using Use synonyms
this
underground station But at 6:00 and 16:00 there were few in Linking Words
number
nearly 100. Along Use synonyms
this
Linking Words
graph
, It was more fluctuated and don't have any steady Use synonyms
number
unlike in few hours between 11:30 and 14:00.
The given line Use synonyms
graph
which start increasing in the early morning, decrease after 8:00 and Use synonyms
also
again start increase after 10:00 but not as same in the beginning of the day. After the few hours of increase it start maintain a steady pleateau for the two hours. Linking Words
Although
, There were a more fluctuation found in post mid Linking Words
time
on comparing with the pre mid Use synonyms
time
. EvenThough it got to fall after 18:00, After it reach the 20:00 it starts to rise up. Despite of the Use synonyms
number
it comprise that there were Use synonyms
also
some passengers are there who travel at the late night. At the Linking Words
last
hour Linking Words
also
the Linking Words
number
is not at all less than the starting Use synonyms
number
.
To summarise Use synonyms
this
Linking Words
graph
, Even they have more variation in their count, It always maintain a considerable count inspite of their Use synonyms
time
.Use synonyms