
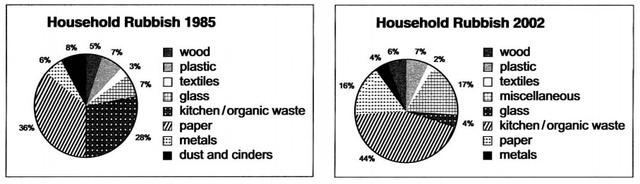
These two pie charts illustrate the data about the composition of household trash for the United Kingdom in 2 different years: 1985 and 2002. There are 8 categories, based on different types of rubbish.
On the first pie chart, it shows that 36% of trash is paper in 1985. The
second
biggest segment is kitchen/organic waste at 28%. The rest parts are: both metals and wood at 8% and glass with plastic make up 14% in total. The smallest part is dust and cinders at 5%.
In the Linking Words
second
pie chart, dust and cinders are replaced with miscellaneous. There are about 16% of paper followed by 44% of kitchen/organic waste in 2002. 17% of chart belongs to miscellaneous, plastic and wood at 7 and 6% respectively. To give a glance at small parts, it can be seen, that both metals and glass make up 8% in sum. Textiles have the smallest proportion, at just 2%.
As an Linking Words
overall
trend, Linking Words
while
the percentage for the majority types of rubbish falls, the kitchen/organic waste rises.Linking Words