
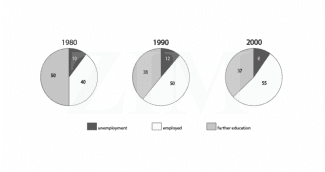
The given pie charts compare the activities Australian students after completing their graduation in three different years 1980,1990 and 2000. The given pie charts are divided
Change preposition
of
refring
three Correct your spelling
referring
catogeries
Correct your spelling
categories
further
studies , jobs and those who left unemployed.
Now Linking Words
compariring
the data in 1980 50 Correct your spelling
comparing
percent
of students continued their studies after graduation. The Change the spelling
per cent
percentage
decreased to 38% in 1990 and Use synonyms
slight
decline in 2000. 40% of the Add an article
a slight
graduates
started their career and get Use synonyms
job
but Add an article
a job
the job
number
of employed Change the article
the number
graduates
increased by Use synonyms
percentage
50% and 55% in 1990nand 2000 respectively. Use synonyms
Linking Words
However
after Add a comma
,However
graduation
10% remain jobless in 1980 the number of jobless Add a comma
,graduation
gradutaes
increased to 12% in 1990 and Correct your spelling
graduates
then
Linking Words
value
again decreased to 8% in 2000.
Correct article usage
the value
Overall
in Linking Words
1980
more Add a comma
,1980
graduates
preferred higher studies and in 2000 Use synonyms
Correct article usage
a heigher
heigher
Correct your spelling
higher
percentage
of students Use synonyms
preffered
jobs the Correct your spelling
preferred
percentage
of unemployed Use synonyms
graduates
is Use synonyms
maximum
in 1990.Correct article usage
the maximum