
The given line graph represents
the
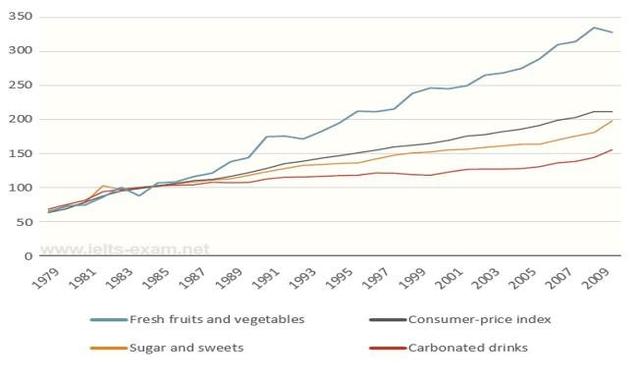
information about the cost changing of different consumable products, including fruits and vegetables, sugar and sweets, Correct article usage
apply
consumer-
Add an article
the consumer-price
price
index, and carbonated drink from 1978 to 2009.
The general overview here is that prices in all categories had increased, Use synonyms
while
fresh fruits and vegetables became the most expensive among the other. Linking Words
on the other hand
, the Linking Words
price
of soft Use synonyms
drink
slowly grew up over 30 years.
Fix the agreement mistake
drinks
According to
the data, every kind of product had changed in Linking Words
price
in positive ways for a producer. Use synonyms
For instance
, fruits and vegetables before it became around 330 in 2009, Linking Words
it
used to Correct pronoun usage
apply
only
50 at the beginning of the given period. Add a missing verb
be only
On the contrary
, carbonated drinks had slightly changed in cost. Over 30 years old, Its Linking Words
price
was approximately 100 higher than at the start.
For the rest, they both had Use synonyms
similarity
in trend. Their Fix the agreement mistake
similarities
price
had risen gradually. Use synonyms
Although
their pattern was in the same way, the consumer-Linking Words
price
index was a little bit higher than sugar and sweetsUse synonyms