The charts below shows the percentage of people who ate five proportions of fruits and vegetables per day in the UK from 2001 to 2008.

The charts below shows the percentage of people who ate five proportions of fruits and vegetables per day in the UK from 2001 to 2008.
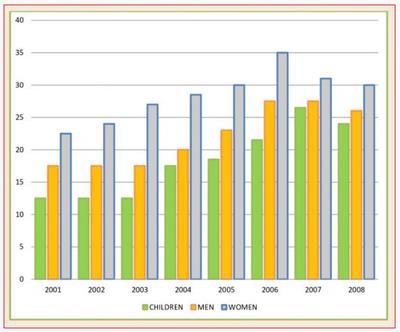
The bar chart depicts the proportion of people who ate five portions of fruits and
vegetables
each day in the UK from 2001 to 2008.
Overall
, it can be seen that the highest percentage of consuming fruit and
vegetables
was women,
while
children considerably accounted for the least. The percentage of women who ate fruit and
vegetables
started at just over 20 % in 2001.
This
figure,
then
rose steadily to reach a peak of almost 35 % in 2006, before falling slightly to 30 % in the final year. In terms of men and children eating
fruit's
Change noun form
fruit
show examples
and
vegetables
remain edible
stable
Correct word choice
and stable
show examples
in the first three years (about 17% and 12% respectively.) From
this
point
Add a comma
,point
show examples
the proportion of men climbed up and reached
at
Change preposition
apply
show examples
about 27 % in both 2006 and 2007, after which it dropped to a boutique 26 %.
A similar
Remove the article
Similar
show examples
growth in the figure was evident reaching 25 % in 2007 and around 24 % in the final year.

Unauthorized use and/or duplication of this material without express and written permission from this site’s author and/or owner is strictly prohibited. Excerpts and links may be used, provided that full and clear credit is given to Writing9 with appropriate and specific direction to the original content.

Vocabulary: Replace the words vegetables with synonyms.
Vocabulary: The word "figure" was used 2 times.
Vocabulary: The word "percentage" was used 2 times.
Vocabulary: The word "proportion" was used 2 times.
Vocabulary: The word "reach" was used 2 times.
Vocabulary: The word "about" was used 2 times.
Topic Vocabulary:
  • dietary habits
  • nutritional intake
  • health-conscious
  • percentages
  • fluctuations
  • peak
  • trough
  • public health initiatives
  • recommended intake
  • demographic differences
  • graphical analysis
  • upward/downward trend
  • health implications
  • national averages
  • gender disparities
What to do next:
Look at other essays: